
Software that has been serving you well for years can suddenly turn its back on you. When we updated Asterisk on our staging environment, it turned out half of our test phones could no longer negotiate any codecs; when we updated Ejabberd, it eagerly blocked our nginx frontend proxy due to a DoS protection feature; and now, we’ve updated Kamailio only to figure out it’s bound to run out-of-memory in weeks.
Introduction
Ever since the beginning of the Compass platform in 2008, we’ve been using a considerable amount of open-source products. We would never have been able to build our platform without leaning on existing projects. During these 11 years, we have learned that using these external dependencies comes at a price. Most software projects have a good, a bad and most often, an ugly side.
In this article, we’ll tackle a memory leak we’ve encountered in Kamailio, which we’ve been using ever since the creation of our platform. Kamailio is a well-known and popular SIP server. It’s written in C++ and has proven itself to handle enormous loads. We currently handle over 1 million calls per week, but much larger VoIP providers have also testified to the great capabilities of Kamailio.
Memory in Kamailio
As all software developers know, C/C++ languages are historically well-known for the difficulty of correct memory handling. Kamailio has a special memory model, and comes bundled with its own memory manager. Or actually, with a number of them…
Kamailio uses a forking process model, in which the main process forks into/spawns a number of child/worker processes. SIP messages can be handled by any of the workers, allowing Kamailio to operate on multiple cores in parallel. The amount of Kamailio processes can be configured using the children option. For a detailed analysis and some tuning recommendations, see Evariste Systems Blog article on tuning Kamailio.
Sometimes data needs to be shared across processes, ie. when the handling of a SIP packet needs state of a previous SIP packet in that transaction/dialog. For this purpose, Kamailio reserves a block of shared memory, which is shared by all processes. For memory blocks that are only needed in one process, Kamailio uses package memory.
Both memory types have a fixed (but configurable) amount of bytes to their dispersal. For example, by default, each Kamailio process reserves 8 MB of package memory per worker, and 64 MB of memory to be shared among all workers.
Monitoring
Because Kamailio reserves the whole blocks of memory at startup, the OS will report that amount of memory being in-use at all times; it cannot see which part of that memory is internally allocated by the Kamailio memory manager. So trying to use ps or top as memory monitors for Kamailio will not help. The same problem arises too, for example, for a Java JVM process.
Luckily, Kamailio has a RPC interface which can print detailed information about the memory allocation status. Enabling it is easy:
#!substdef "/HTTP_PORT/4000/"
listen=tcp:127.0.0.1:HTTP_PORT

loadmodule "xhttp.so"
loadmodule "jsonrpcs.so"

tcp_accept_no_cl=yes

modparam("jsonrpcs", "transport", 1)

event_route[xhttp:request] {
    if ($hu =~ "^/RPC") {
        jsonrpc_dispatch();
    }
    else {
        xhttp_reply("404", "OK", "text/html", "<html><body>Wrong URL $hu</body></html>");
    }
}
Monitoring shared memory
Given you’ve installed curl and json_pp, this simple command provides us with a bunch of statistics:
curl \
  -d '{"jsonrpc":"2.0", "id":"1", "method": "stats.get_statistics", "params": ["all"]}' \
  -X POST \
  http://127.0.0.1:4000/RPC \
  | json_pp
A cut-down version of the output, showing various statistics on shared memory usage:
{
  "result": [
    "shmem:fragments = 253",
    "shmem:free_size = 129135264",
    "shmem:max_used_size = 5247968",
    "shmem:real_used_size = 5082464",
    "shmem:total_size = 134217728",
    "shmem:used_size = 4590016"
  ]
}
We use a Munin-plugin to graph these values:
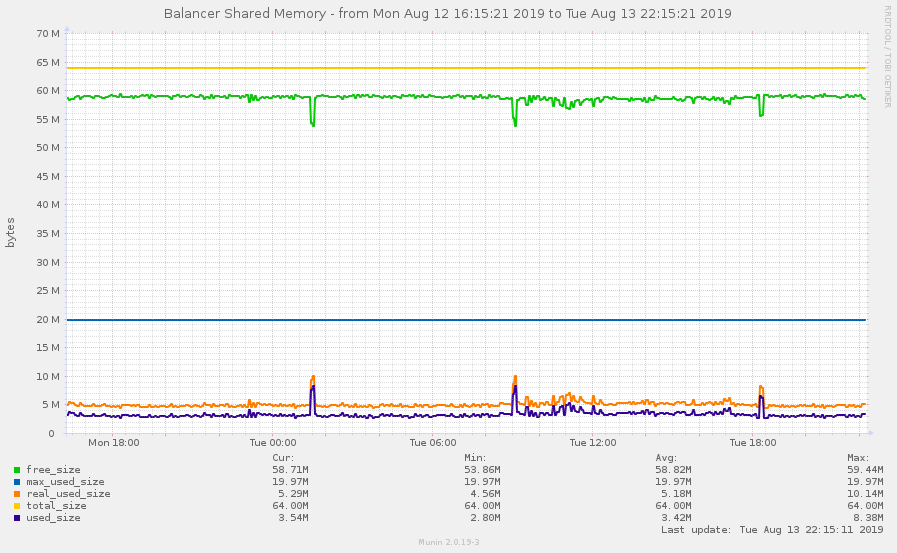
As expected, when used_size increases, the free_size decreases. The blue max_used_size line is interesting, as it shows the highest usage since the initial startup of Kamailio.
Monitoring package memory
So package memory is a block of memory allocated for each Kamailio process. To monitor package memory, we can use the pkg.stats RPC command.
curl \
  -d '{"jsonrpc":"2.0", "id":"1", "method": "pkg.stats", "params": []}' \
  -X POST \
  http://127.0.0.1:4000/RPC \
  | json_pp
This will return an array of statistics; one entry in the array correspondents to one process.
{
  "result": [
    {
         "pid" : 24431,
         "rank" : 0,
         "free" : 10644072,
         "real_used" : 1938840,
         "total_size" : 12582912,
         "total_frags" : 12,
         "used" : 1278120,
         "entry" : 0
    },
    ...
  ]
}
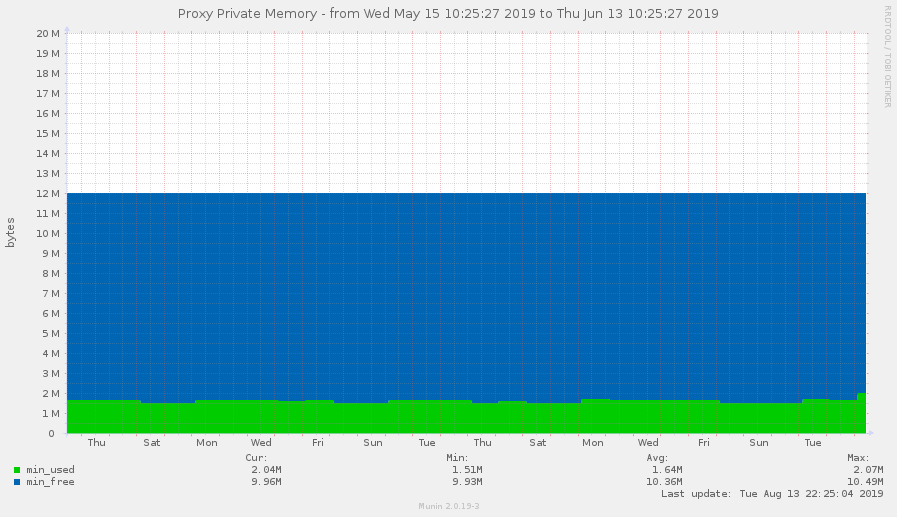
For monitoring purposes, we find in this array the entry with the least amount of free memory. This makes for an easy-to-understand graph and shows us the most critical process; the weakest link, so to say.
The min_used line in the graph below follows the used value of the process consuming the most memory, and min_free follows the free value of that same process. In each moment of time, both values add up to the total size of the package memory, being 12M in this configuration.
The leak
One day, our sysadmins complained about a dangerously looking line in Munin. This is the actual Munin data of one of our production machines; due to the RRD storage format the resolution has been decreasing over time.
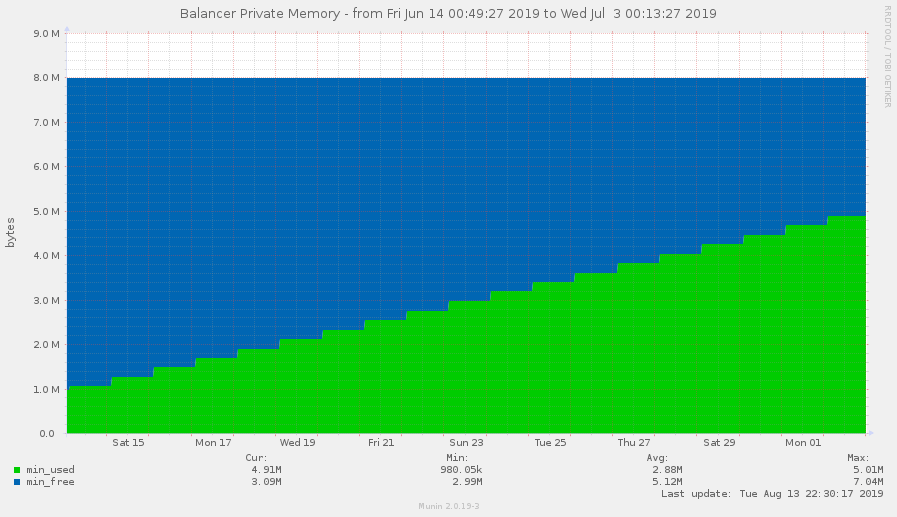
So there is definitely a leak in our Kamailio instance, quickly eating up memory. In two weeks, memory usage has been increasing from 1 MB to rougly 5 MB, out of 8 MB available package memory.
Finding the cause
The first and easiest clue comes from the fact that we have just 1 server that shows this behavior. Other (identically configured) Kamailio instances were not showing any leaks. Looking through our logs in Elasticsearch, we found that the leaking server wrote a lot of log entries complaining about malformed SIP, while the others didn’t (as much).
NOTICE: Malformed SIP received. ua: [Yealink SIP-T48G 35.72.188.7] received from <123.123.123.123>
This correspondents to our (newly added) usage of the sanity module in Kamailio, allowing us to get insights in which devices send invalid packets.
loadmodule "sanity.so"

route {
    if (!sanity_check()) {
        xlog("L_NOTICE", "Malformed SIP received. ua: [$ua] received from: <$si:$sp>");
        ...
    }
Next step: get a SIP trace and see what SIP message is causing the sanity module to act up; sadly, the module won’t really give you much information in tracing the cause of the sanity failure.
SUBSCRIBE sip:aaa@bbb:5060 SIP/2.0
CSeq: 1 SUBSCRIBE
User-Agent: Yealink SIP-T48G 35.72.188.7
Proxy-Require: sip.mysipproxy.com
Content-Length: 0
This is a cut-down version of the packet, but we can identify what’s going on here: the Yealink phone sends a hostname in the Proxy-Require header, which is not really what this header was meant for (see RFC 3261 section 20.29 and the IANA table of allowed options).
NOTE: the sanity module requires you to manually configure all values that you want to accept for Proxy-Require; by default, all values are considered bad (as of Kamailio 5.2.3).
Finding the leak
OK, so we have a Yealink phone that causes a sanity module check to fail. No a big deal; the phone will operate just fine, as our platform doesn’t care about this invalid header. But this indeed causes a leak in Kamailio package memory?
Let’s take src/modules/sanity/sanity.c of the Kamailio version we were using at the time (github link and investigate:
if (msg->proxy_require != NULL) {
  ...
  r_pr = msg->proxy_require->parsed;
  while (r_pr != NULL) {
    ...
    if (...) {
       LM_DBG("request contains unsupported extension: %.*s\n",
         r_pr->string.len, r_pr->string.s);
       ...
       return SANITY_CHECK_FAILED;
    }
    ...
  }
  LM_DBG("checking proxy require passed\n");
  if (msg->proxy_require->parsed) {
    /* TODO we have to free it here, because it is not automatically
     * freed when the message freed. Lets hope nobody needs to access
     * this header again later on */
    free_str_list(msg->proxy_require->parsed);
    msg->proxy_require->parsed = NULL;
  }
}
The trained eye will quickly see that if the proxy_require value is unsupported, the function will return SANITY_CHECK_FAILED, but forgets to free the msg->proxy_require_parsed structure. As the TODO shows, this function shouldn’t really be responsible for doing this in the first place; but as long as the function is responsible, it needs to do so in ALL code paths.
Fixing
The proper fix is to add a free_str_list to all error cases. We’ve filed Github issue #1990 in the Kamailio repository for this, and four days later, the Kamailio team pushed a commit to fix this problem.
Although the response of Kamailio is very quick here, we couldn’t wait for the next Kamailio version to be released. As the graphs show, within 1-2 weeks the process would be out of package memory.
We don’t like to run patched software, but in cases like this, there is often very little choice than to package our own fixed version and deploy that. Luckily, in this case, the sanity module has an option to pick which sanity checks to perform. By disabling the proxy-require check, we simply bypass the memory leak:
# This is the default sanity check set (3047) minus the proxy require check (512)
# We don't want this check as it leaks memory if the header is present and parsable but invalid.
# See: https://https://github.com/kamailio/kamailio/issues/1990
modparam("sanity", "default_checks", 2535)
Conclusion
Without open-source software, the Compass platform wouldn’t be as far as it is now. Of course, every piece of software contains bugs that you might run into, at inconvenient times or in unexpected ways. But it’s the power of open-source that enables us to do an in-depth investigation into these problems, based on the source code. We are happy to give back to the community in the form of a bug report, a patch or both. With open-source products, we can even patch our deployments before the fix makes it into a new upstream release.
Luckily, our monitoring scripts triggered us to investigate this memory leak early on, so we could investigate and resolve it without client impact.
We’re be happy to share our scripts! You can find them in the IPerity compass-monitoring Github repository.